SPACEc:Distance permutation analysis
import spacec as sp

#import standard packages
import os
import pandas as pd
import scanpy as sc

# silencing warnings
import warnings
warnings.filterwarnings('ignore')
INFO:root: * TissUUmaps version: 3.1.1.6
/home/tim/miniforge3/envs/spacec/lib/python3.9/site-packages/numba/np/ufunc/parallel.py:371: NumbaWarning: The TBB threading layer requires TBB version 2021 update 6 or later i.e., TBB_INTERFACE_VERSION >= 12060. Found TBB_INTERFACE_VERSION = 12050. The TBB threading layer is disabled.
  warnings.warn(problem)
/home/tim/miniforge3/envs/spacec/lib/python3.9/site-packages/cudf/utils/gpu_utils.py:89: UserWarning: A GPU with NVIDIA Volta™ (Compute Capability 7.0) or newer architecture is required.
Detected GPU 0: NVIDIA GeForce GTX 1070
Detected Compute Capability: 6.1
  warnings.warn(
# set plotting parameters
sc.settings.set_figure_params(dpi=80, facecolor='white')
# Specify the path to the data
root_path = "/home/user/path/SPACEc/" # inset your own path

data_path = root_path + 'example_data/raw/' # where the data is stored

# where you want to store the output
output_dir = root_path + 'example_data/output/'
os.makedirs(output_dir, exist_ok=True)
# Load data
adata = sc.read(output_dir + "adata_nn_demo_annotated_cn.h5ad")
adata
AnnData object with n_obs × n_vars = 46789 × 59
    obs: 'DAPI', 'x', 'y', 'area', 'region_num', 'unique_region', 'condition', 'leiden_1', 'leiden_1_subcluster', 'cell_type_coarse', 'cell_type_coarse_subcluster', 'cell_type_coarse_f', 'cell_type_coarse_f_subcluster', 'cell_type_coarse_f_f', 'cell_type', 'CN_k20_n40', 'CN_k20_n30', 'CN_k20_n20', 'CN_k20_n25', 'CN_k20_n6', 'CN_k20_n6_annot'
    uns: 'CN_k20_n6_colors', 'Centroid_k20_n20', 'Centroid_k20_n25', 'Centroid_k20_n30', 'Centroid_k20_n40', 'Centroid_k20_n6', 'cell_type_coarse_f_colors', 'cell_type_colors', 'dendrogram_cell_type_coarse_f_subcluster', 'leiden', 'leiden_1_colors', 'neighbors', 'umap', 'unique_region_colors'
    obsm: 'X_pca', 'X_umap'
    layers: 'scaled'
    obsp: 'connectivities', 'distances'
Identify potential interactions
# compute the potential interactions
distance_pvals = sp.tl.identify_interactions(
    adata = adata, # AnnData object
    cellid = "index", # column that contains the cell id (set index if the cell id is the index of the dataframe)
    x_pos = "x", # x coordinate column
    y_pos = "y", # y coordinate column
    cell_type = "cell_type", # column that contains the cell type information
    region = "unique_region", # column that contains the region information
    num_iterations=1000, # number of iterations for the permutation test
    num_cores=10,  # number of CPU threads to use
    min_observed = 10, # minimum number of observed interactions to consider a cell type pair
    comparison = 'condition', # column that contains the condition information we want to compare
    distance_threshold=20/0.5085) # distance threshold in px (20 µm)
index is not in the adata.obs, use index as cellid instead!
Computing for observed distances between cell types!
This function expects integer values for xy coordinates.
x and y will be changed to integer. Please check the generated output!
INFO:root: * TissUUmaps version: 3.1.1.6
INFO:root: * TissUUmaps version: 3.1.1.6
Save triangulation distances output to anndata.uns triDist
Permuting data labels to obtain the randomly distributed distances!
this step can take awhile
INFO:root: * TissUUmaps version: 3.1.1.6
INFO:root: * TissUUmaps version: 3.1.1.6
INFO:root: * TissUUmaps version: 3.1.1.6
INFO:root: * TissUUmaps version: 3.1.1.6
INFO:root: * TissUUmaps version: 3.1.1.6
INFO:root: * TissUUmaps version: 3.1.1.6
INFO:root: * TissUUmaps version: 3.1.1.6
INFO:root: * TissUUmaps version: 3.1.1.6
Save iterative triangulation distance output to anndata.uns triDist
adata.uns['triDist']
| celltype1 | celltype2 | mean_dist | unique_region | iteration | condition | |
|---|---|---|---|---|---|---|
| 0 | B cell | B cell | 17.322904 | reg002 | 1 | tonsillitis |
| 1 | B cell | CD4+ T cell | 18.485693 | reg002 | 1 | tonsillitis |
| 2 | B cell | CD8+ T cell | 17.229160 | reg002 | 1 | tonsillitis |
| 3 | B cell | DC | 17.252697 | reg002 | 1 | tonsillitis |
| 4 | B cell | Epithelial cell | 17.441963 | reg002 | 1 | tonsillitis |
| ... | ... | ... | ... | ... | ... | ... |
| 482696 | cDC1 | Neutrophil | 14.764823 | reg001 | 1000 | tonsil |
| 482697 | cDC1 | Plasma cell | 17.054808 | reg001 | 1000 | tonsil |
| 482698 | cDC1 | Treg | 16.820961 | reg001 | 1000 | tonsil |
| 482699 | cDC1 | Vessel | 16.668742 | reg001 | 1000 | tonsil |
| 482700 | cDC1 | cDC1 | 17.044871 | reg001 | 1000 | tonsil |
482701 rows × 6 columns
# save adata
adata.write(output_dir + "adata_nn_demo_annotated_cn.h5ad")
# Identify significant cell-cell interactions
# dist_table_filt is a simplified table used for plotting
# dist_data_filt contains the filtered raw data with more information about the pairs
#  The function outputs two dataframes:  and dist_data_filt that contains all filtered interactions and  dist_table_filt that contains a table for all interactions that show a significant value in both tissues
dist_table_filt, dist_data_filt = sp.tl.filter_interactions(
    distance_pvals = distance_pvals,
    pvalue = 0.05,
    logfold_group_abs = 0.1,
    comparison = 'condition')

print(dist_table_filt.shape)
dist_data_filt
(39, 2)
| celltype1 | celltype2 | condition | expected | expected_mean | keep_x | observed | observed_mean | keep_y | pvalue | logfold_group | interaction | logfold_group_abs | pairs | |
|---|---|---|---|---|---|---|---|---|---|---|---|---|---|---|
| 2 | B cell | CD4+ T cell | tonsil | [17.281922614950506, 17.270623692108778, 17.28... | 17.646184 | True | [21.0, 14.7648230602334, 23.706539182259394, 2... | 16.636922 | True | 1.317440e-46 | -0.084968 | B cell --> CD4+ T cell | 0.084968 | B cell_CD4+ T cell |
| 3 | B cell | CD4+ T cell | tonsillitis | [18.485692875309425, 17.542156808395966, 17.41... | 17.656303 | True | [28.231188426986208, 14.317821063276353, 27.29... | 16.187740 | True | 8.446516e-67 | -0.125282 | B cell --> CD4+ T cell | 0.125282 | B cell_CD4+ T cell |
| 8 | B cell | Epithelial cell | tonsil | [17.128317857502207, 17.472384317332953, 17.42... | 17.744415 | True | [11.180339887498949, 32.0, 13.92838827718412, ... | 17.731290 | True | 1.175790e-04 | -0.001067 | B cell --> Epithelial cell | 0.001067 | B cell_Epithelial cell |
| 9 | B cell | Epithelial cell | tonsillitis | [17.441963049826683, 17.462752937841383, 17.41... | 17.726203 | True | [32.984845004941285, 17.699649415384002, 27.99... | 20.480112 | True | 2.999825e-08 | 0.208340 | B cell --> Epithelial cell | 0.208340 | B cell_Epithelial cell |
| 16 | B cell | Mast cell | tonsil | [17.695167954526006, 18.58880119871868, 18.557... | 17.461009 | True | [15.033296378372908, 16.44427190999916, 18.357... | 15.963641 | True | 1.669109e-03 | -0.129347 | B cell --> Mast cell | 0.129347 | B cell_Mast cell |
| ... | ... | ... | ... | ... | ... | ... | ... | ... | ... | ... | ... | ... | ... | ... |
| 469 | Vessel | Neutrophil | tonsillitis | [16.0063444598664, 18.12053492002032, 15.15022... | 17.369348 | True | [22.135943621178654, 17.4928556845359, 14.1421... | 18.568986 | True | 3.021850e-02 | 0.096351 | Vessel --> Neutrophil | 0.096351 | Vessel_Neutrophil |
| 474 | Vessel | Treg | tonsil | [17.954103317276537, 17.15715454178462, 21.619... | 17.721069 | True | [15.524174696260024, 28.30194339616981, 26.076... | 16.876453 | True | 7.598934e-06 | -0.070454 | Vessel --> Treg | 0.070454 | Vessel_Treg |
| 475 | Vessel | Treg | tonsillitis | [17.087549869721986, 19.013220946273126, 16.84... | 17.743971 | True | [26.832815729997478, 11.661903789690601, 17.20... | 16.225218 | True | 2.884915e-10 | -0.129091 | Vessel --> Treg | 0.129091 | Vessel_Treg |
| 506 | cDC1 | Treg | tonsil | [17.032356746663876, 17.110729499765213, 16.99... | 17.483293 | True | [20.024984394500787, 13.341664064126334, 18.13... | 17.240494 | True | 4.860705e-02 | -0.020176 | cDC1 --> Treg | 0.020176 | cDC1_Treg |
| 507 | cDC1 | Treg | tonsillitis | [16.68538841133706, 17.25883307347274, 20.6700... | 17.504357 | True | [15.033296378372908, 11.180339887498949, 19.69... | 16.065805 | True | 5.797637e-03 | -0.123721 | cDC1 --> Treg | 0.123721 | cDC1_Treg |
88 rows × 14 columns
Visualization
sp.pl.plot_top_n_distances(
    dist_table_filt,
    dist_data_filt,
    n=5,
    colors=None,
    dodge=False,
    savefig=False,
    output_fname="",
    output_dir="./",
    figsize=(5, 5),
    unit="px",
    errorbars=True,
)
condition                      tonsil  tonsillitis  abs_dist
pairs
Mast cell_M1 Macrophage     -0.111741     0.306462  0.418203
CD8+ T cell_Epithelial cell -0.173932     0.148640  0.322572
Epithelial cell_CD8+ T cell -0.127416     0.107586  0.235002
B cell_Epithelial cell      -0.001067     0.208340  0.209407
M2 Macrophage_Mast cell      0.050296    -0.153881  0.204177

sp.pl.dumbbell(data = dist_table_filt, figsize=(8,12), colors = ['#DB444B', '#006BA2'])

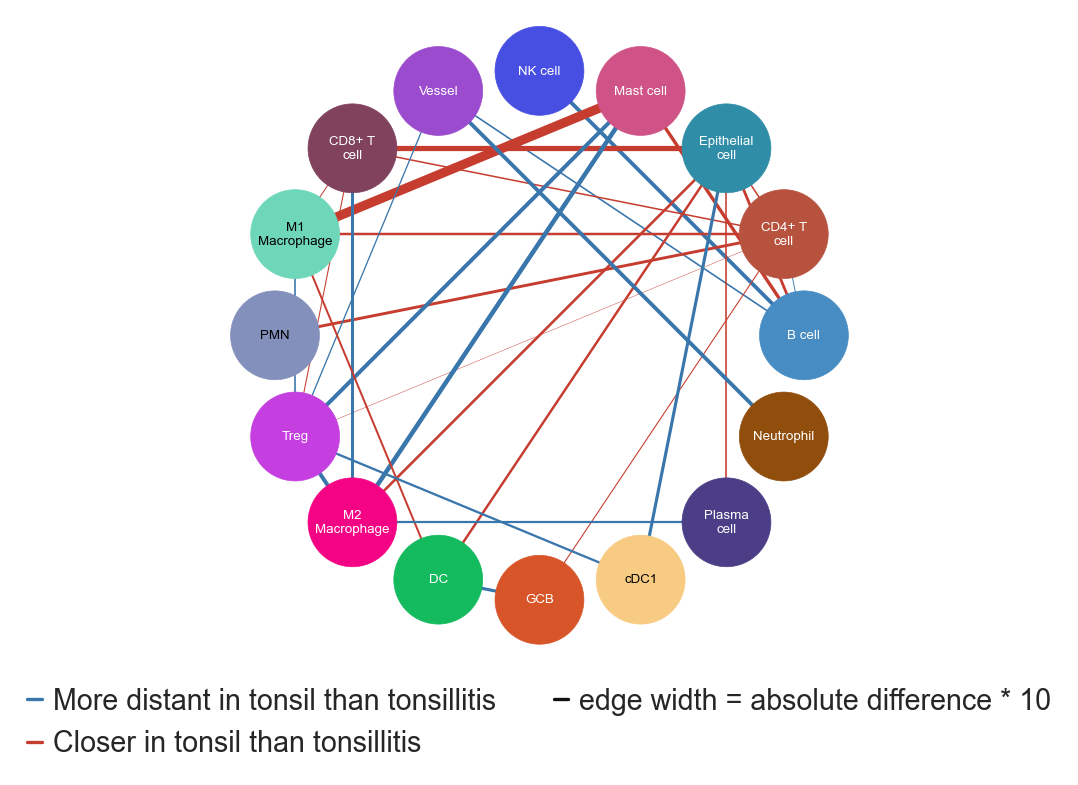
sp.pl.distance_graph(dist_table = dist_data_filt, # the (filtered) distance data table you want to plot
                  distance_pvals = distance_pvals, # the full distance data table
                  condition_pair=['tonsil', 'tonsillitis'],
                  node_size=1600, font_size=6,
                  palette=None,
                  dpi = 600,
                  savefig=False,
                  output_fname="",
                  output_dir=output_dir,)
(88, 14)